| You are herei: Saharan Dust Today is: 19-04-2024 | sei il visitatore numero: 4003 | |
 |
| You are herei: Saharan Dust Today is: 19-04-2024 | sei il visitatore numero: 4003 | |
|


Here is a list of 2008-2011 Saharan Dust events observed by means of the INO LIDAR with 5 min time resolution:
(Click on the dates to get the 24-hours LIDAR color plot)
|
SAHARAN DUST: 2008
|
SAHARAN DUST: 2009
|
SAHARAN DUST: 2010
|
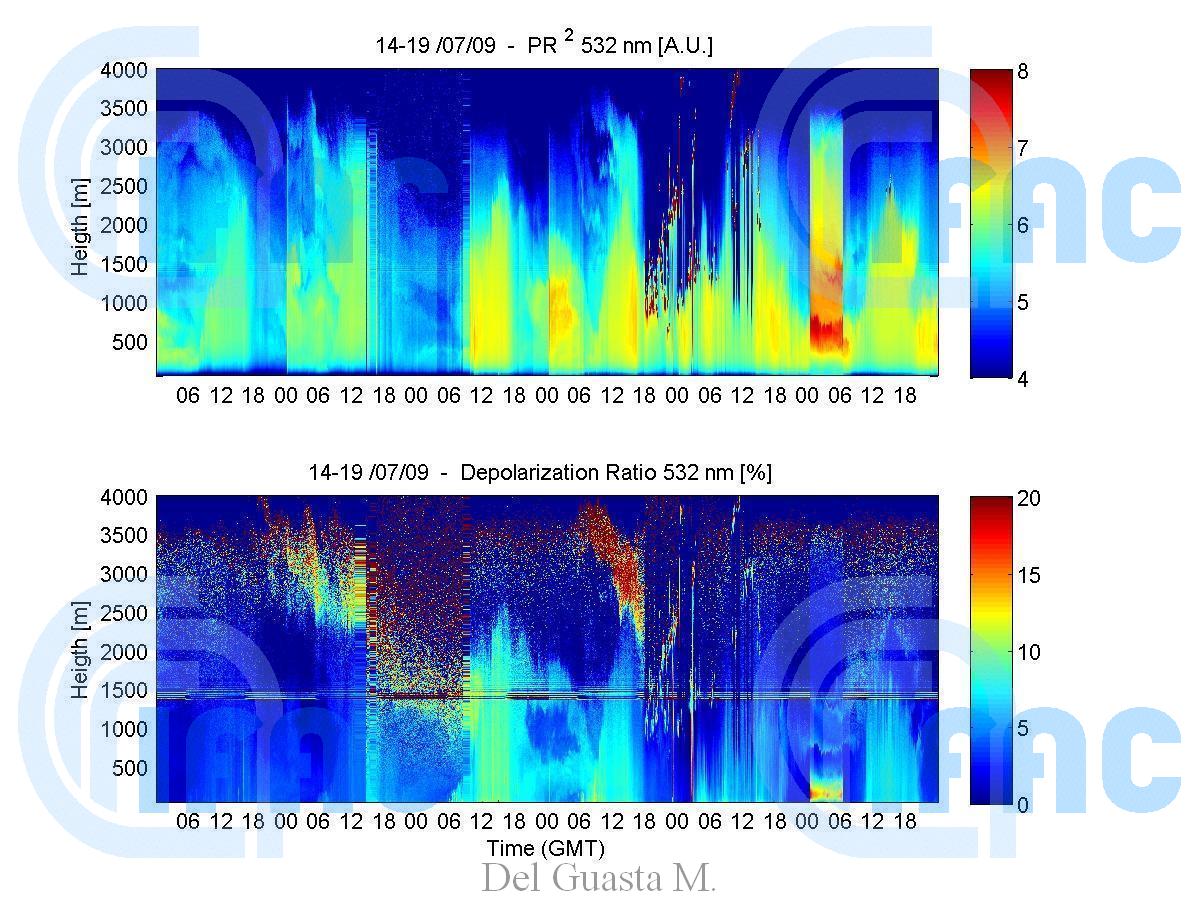
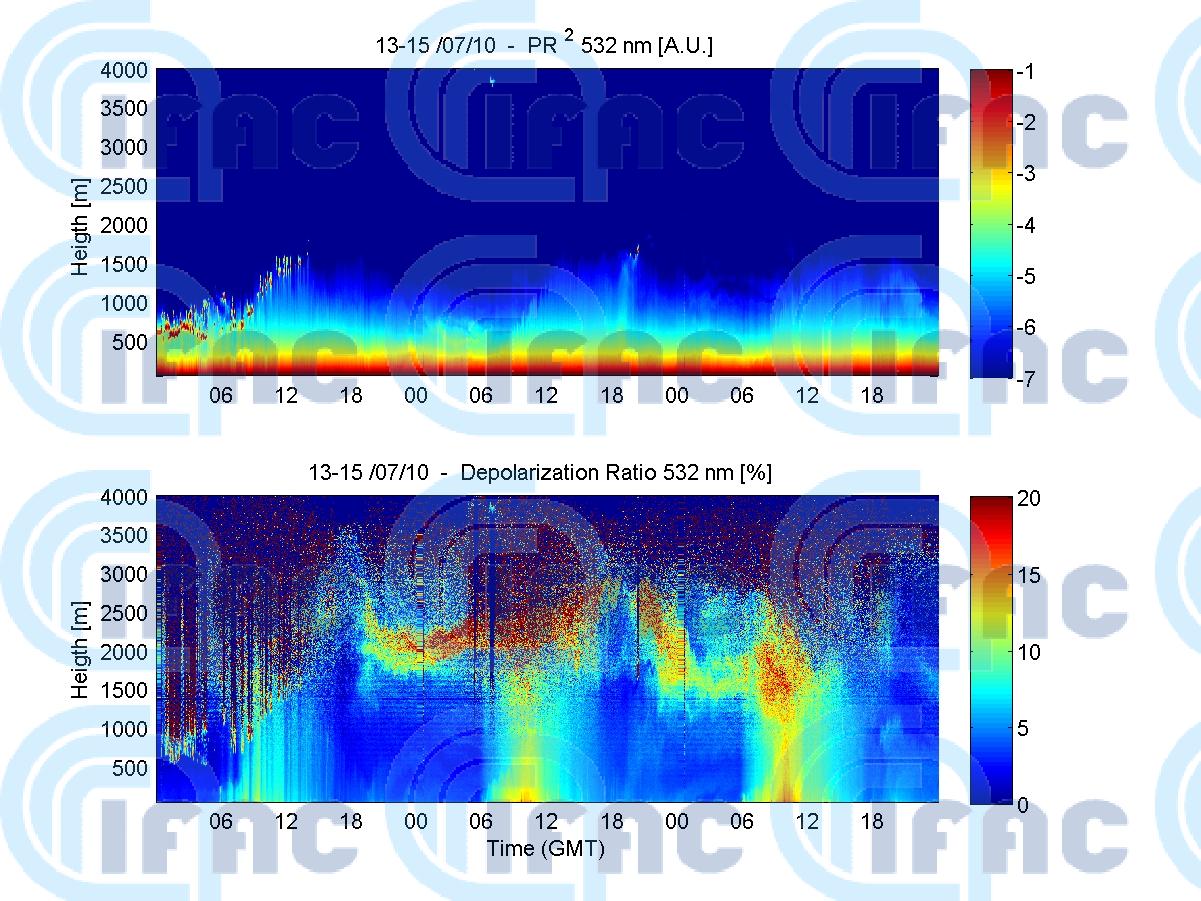
In this HYSPLIT animation, the origin of airmasses at an altitude of 2000-4000 m is shown for the entire period from 15 to 17 July |
In this MODIS NAAPS animation,. the (yellow-green) dust plume from Northern Africa is shown for the entire period from 15 to 17 July |
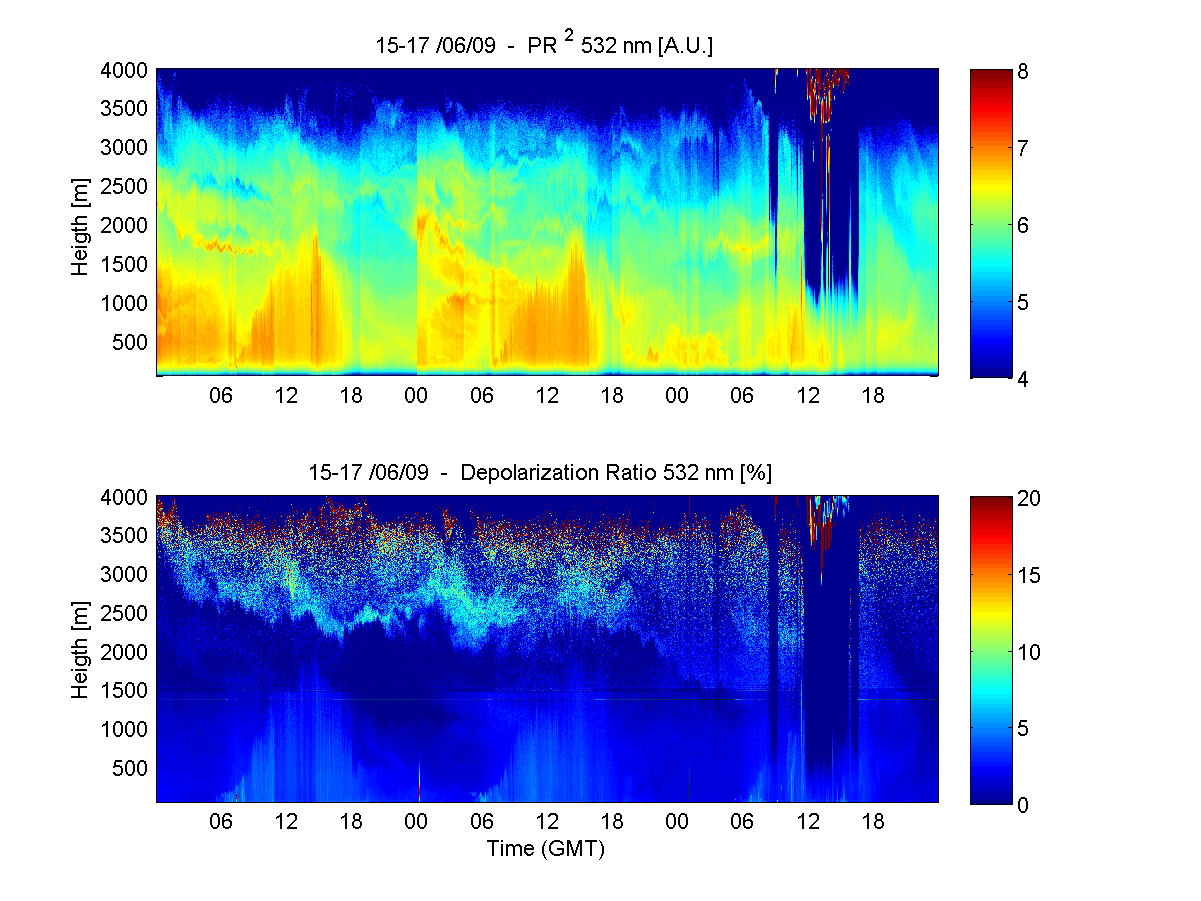
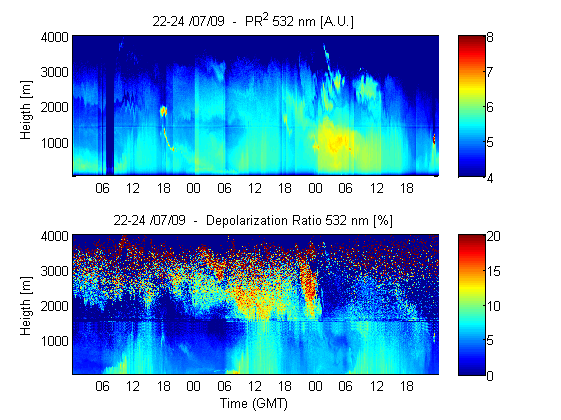
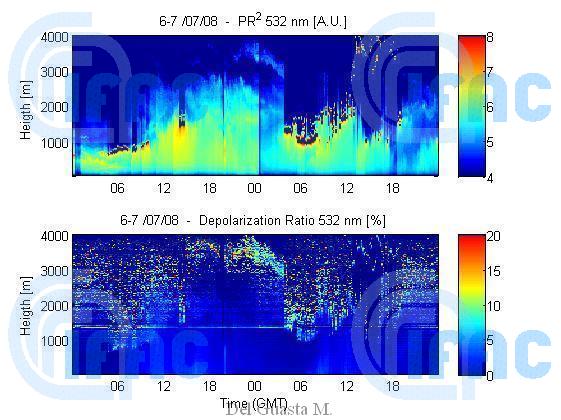
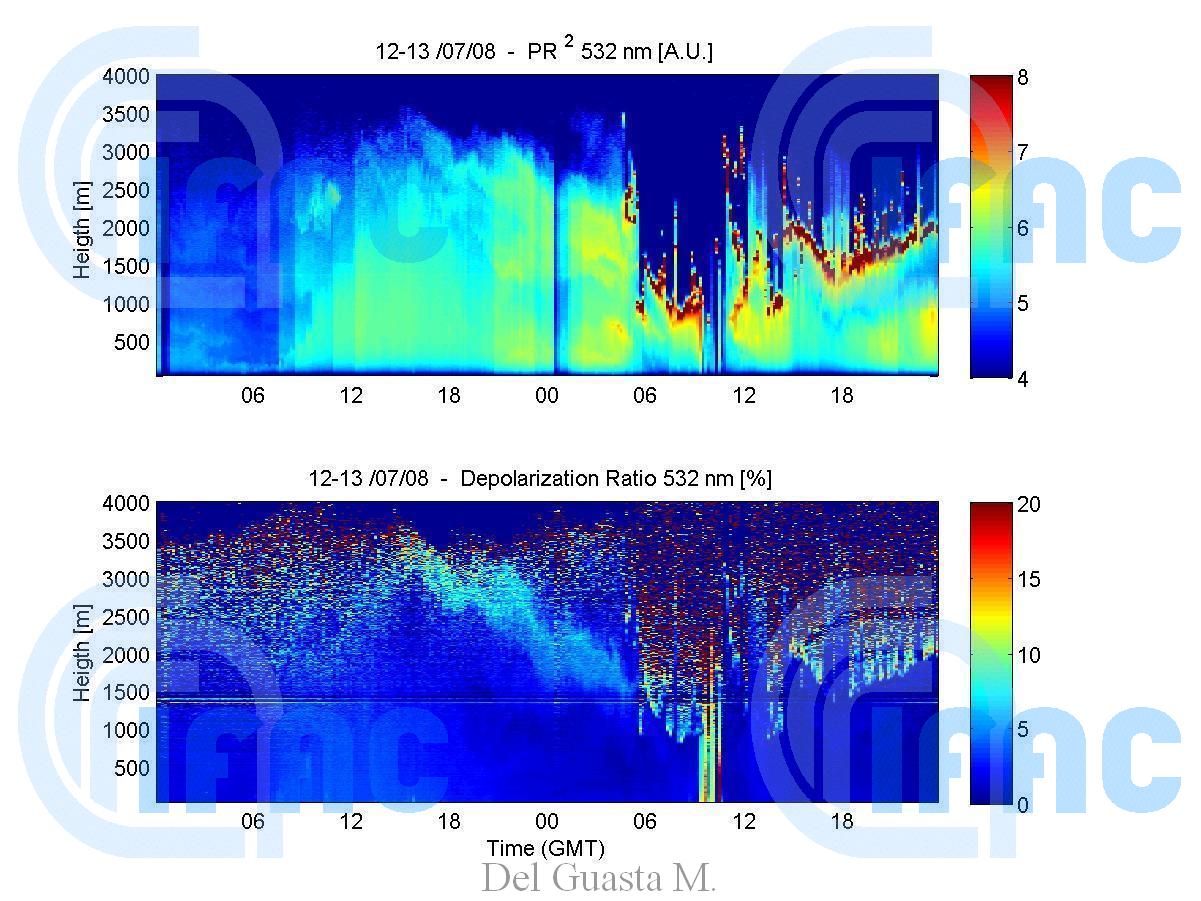
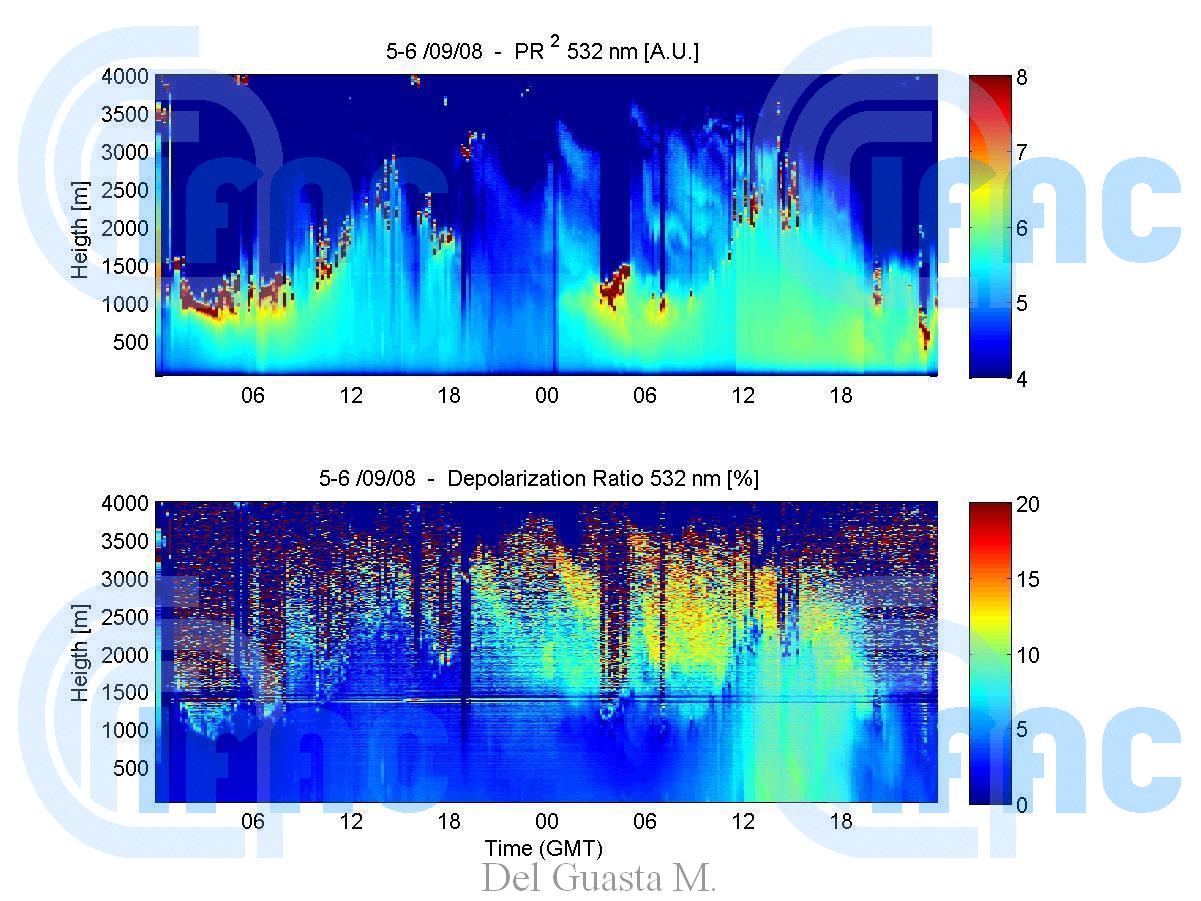
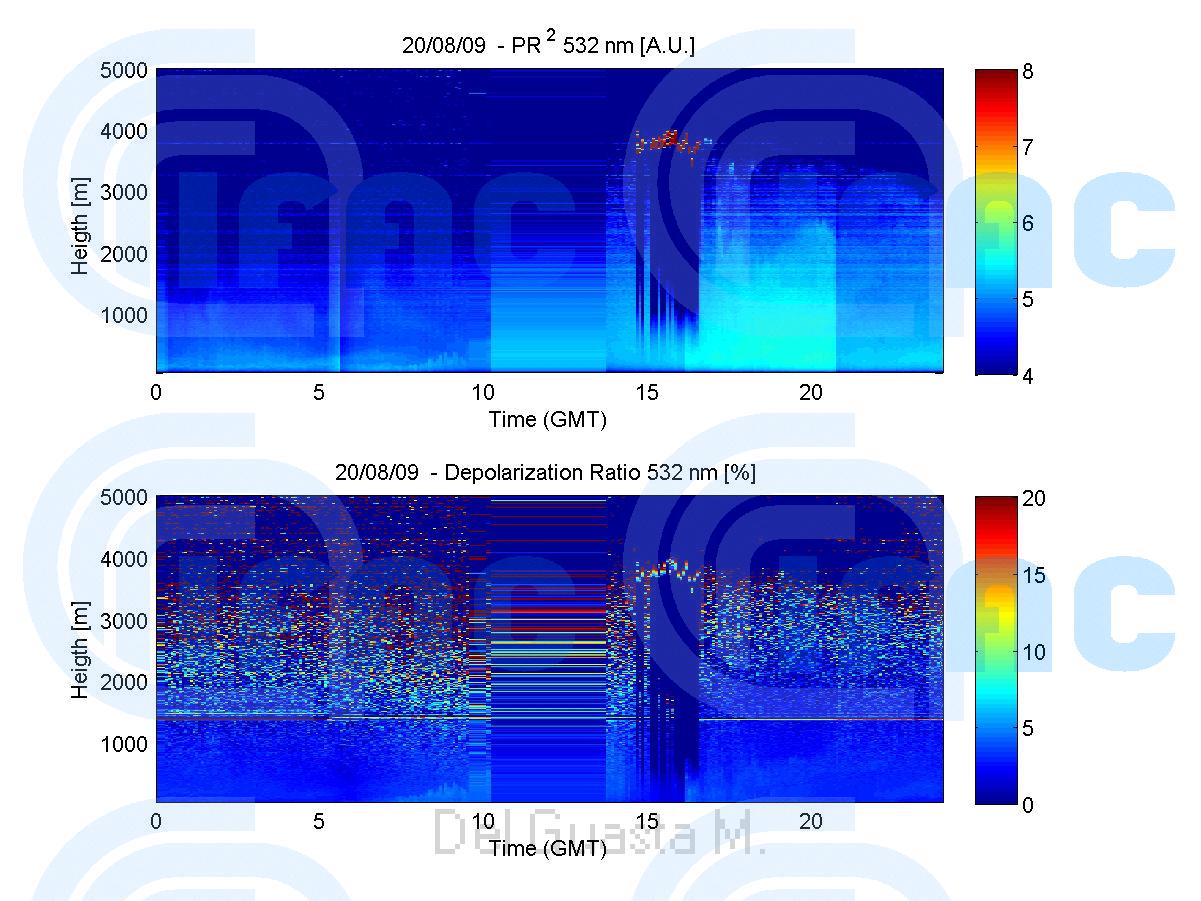
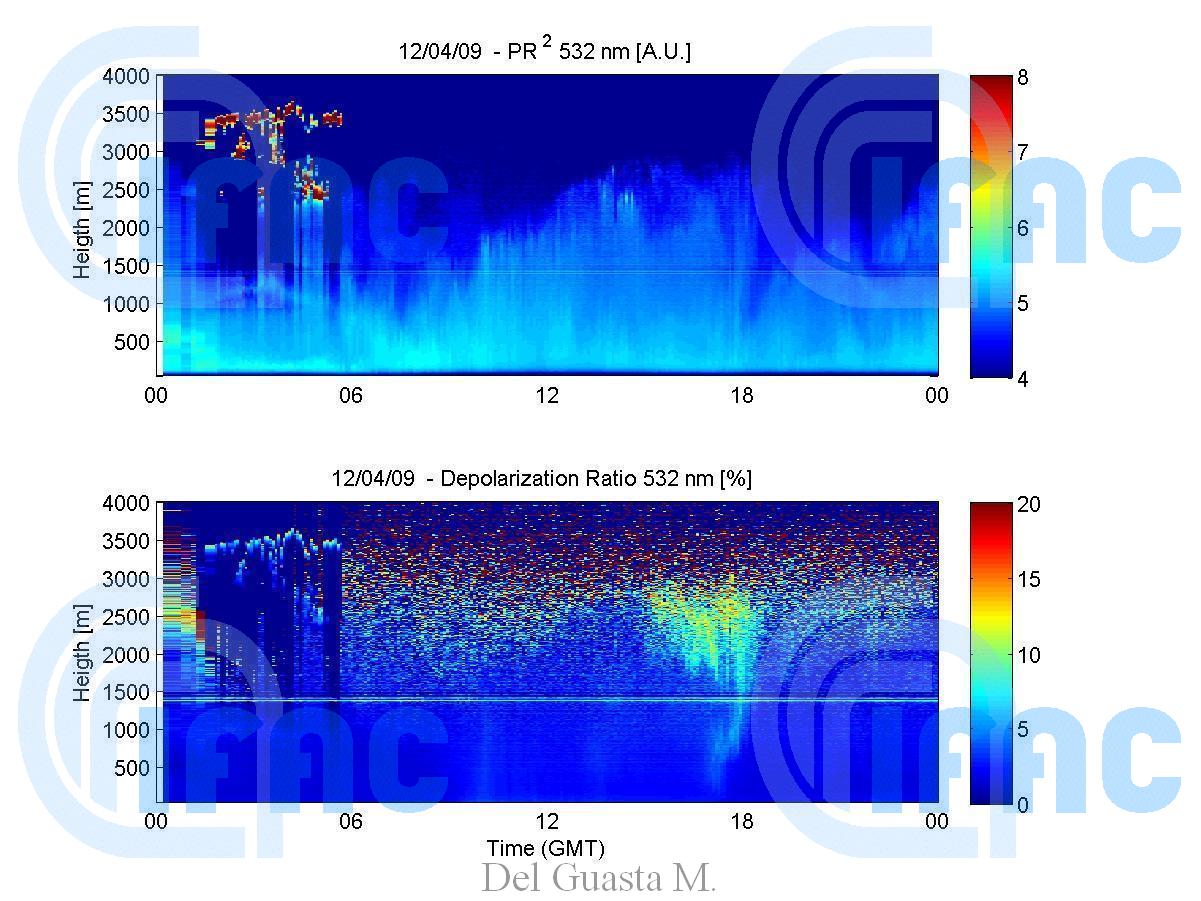
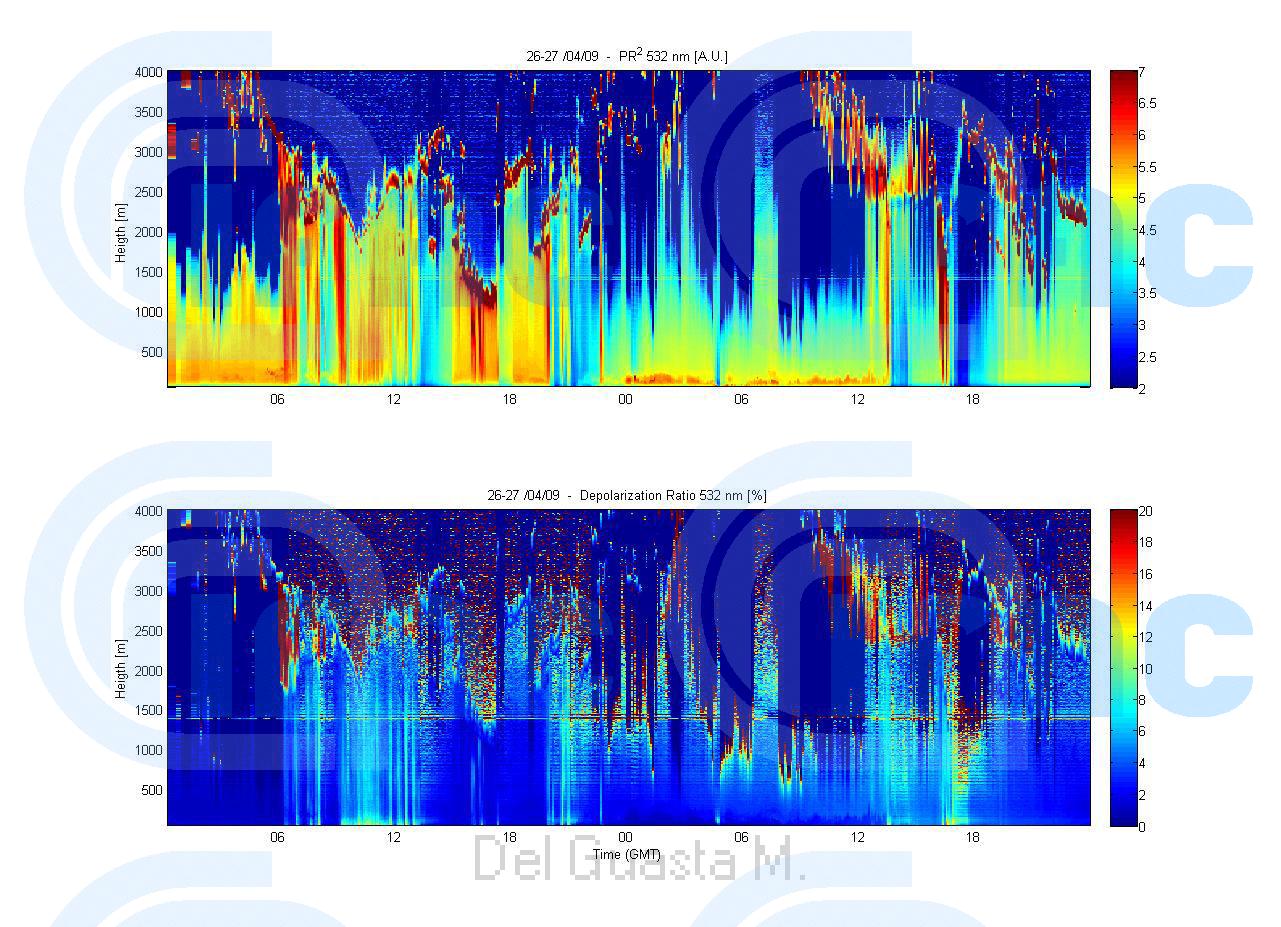
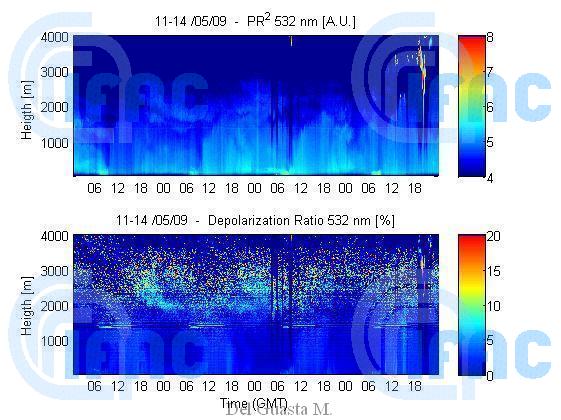
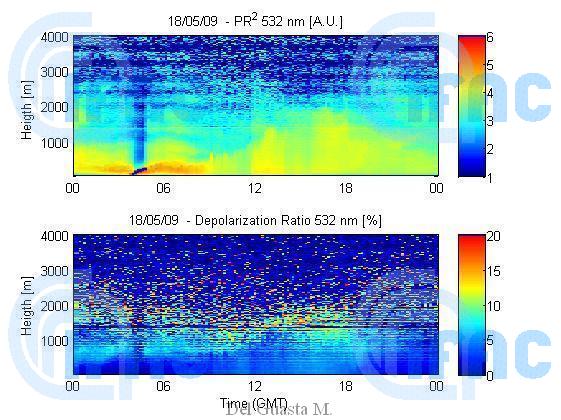
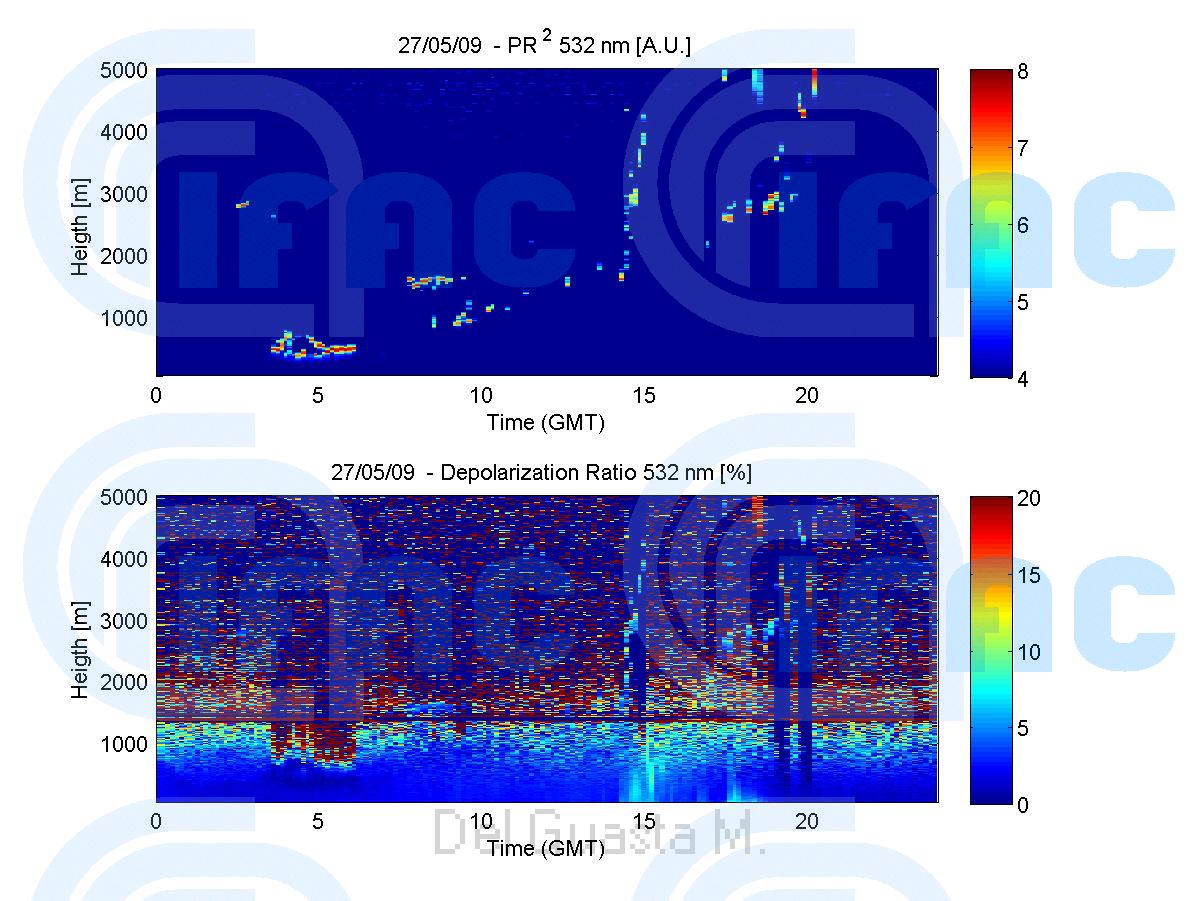
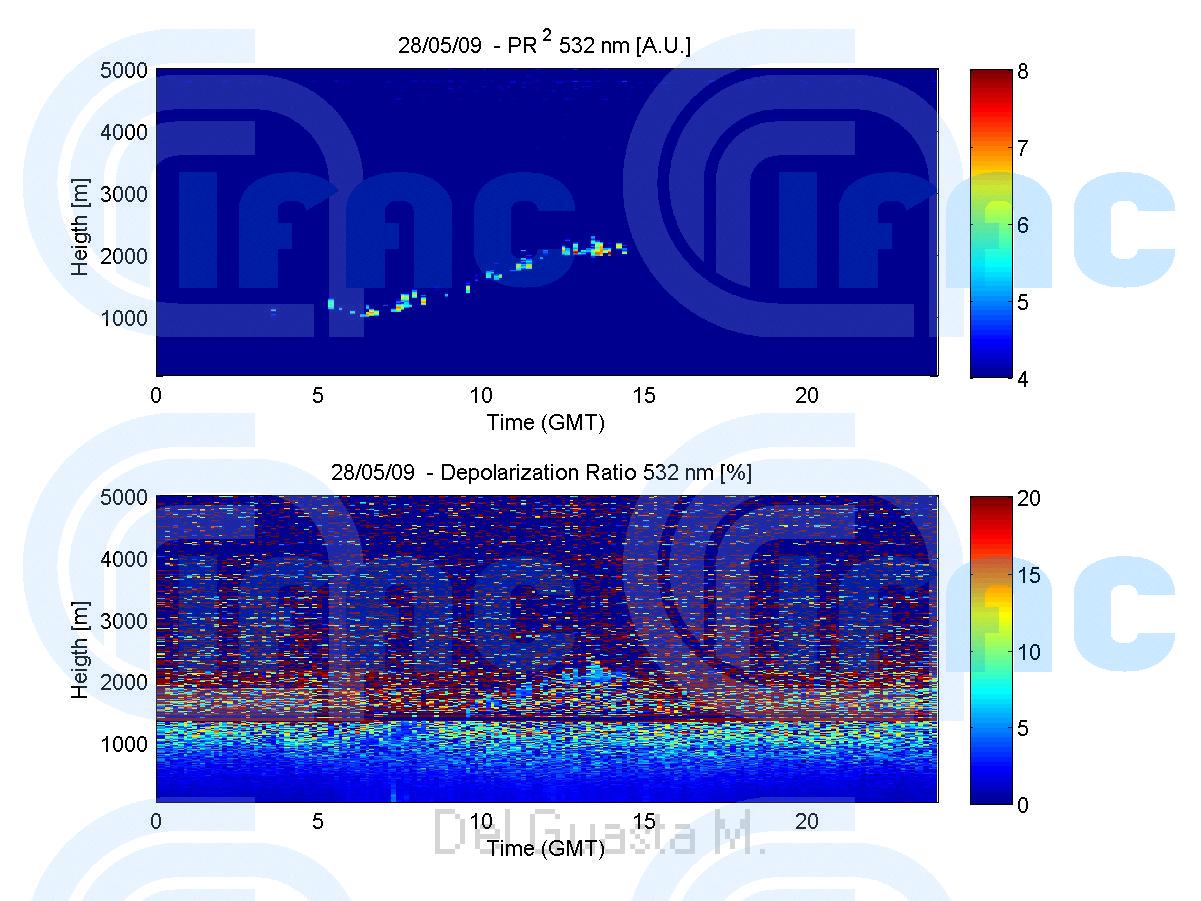
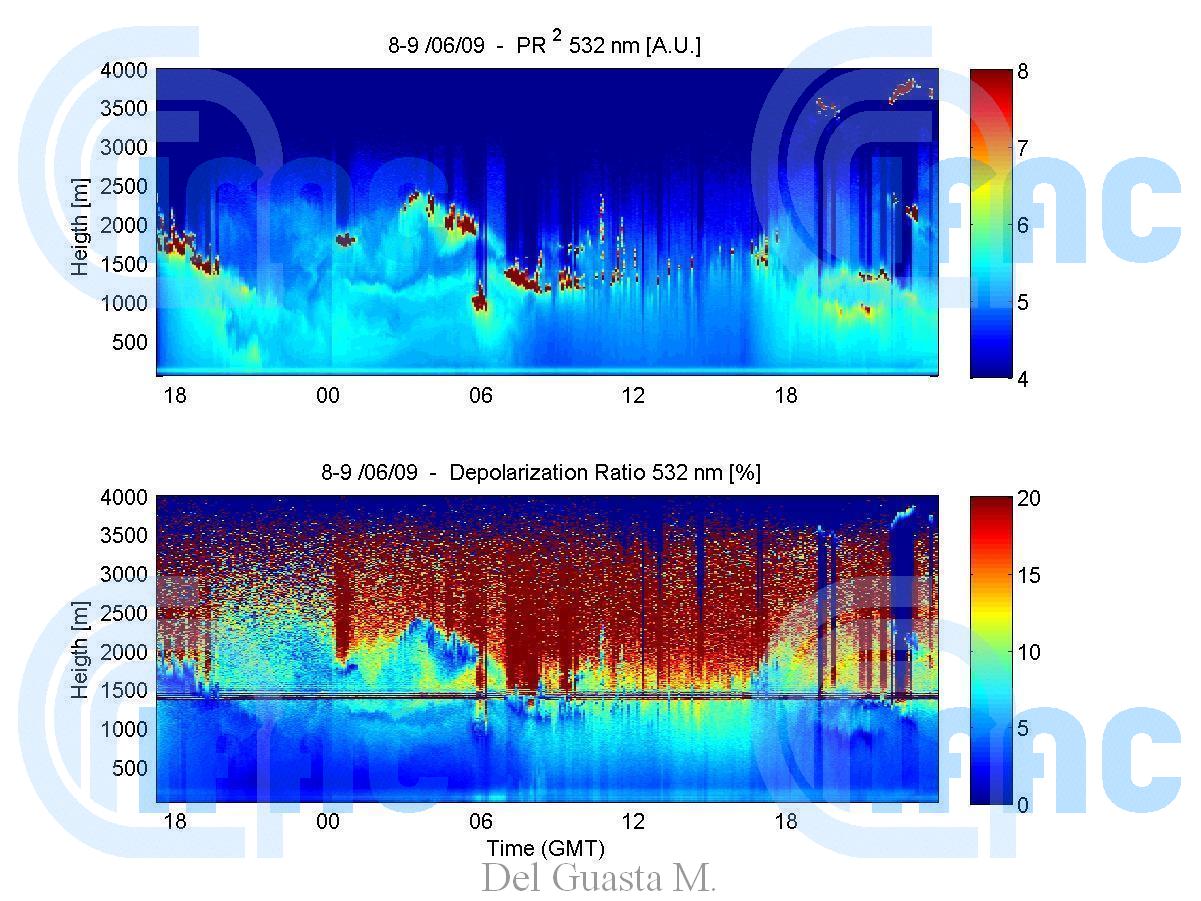
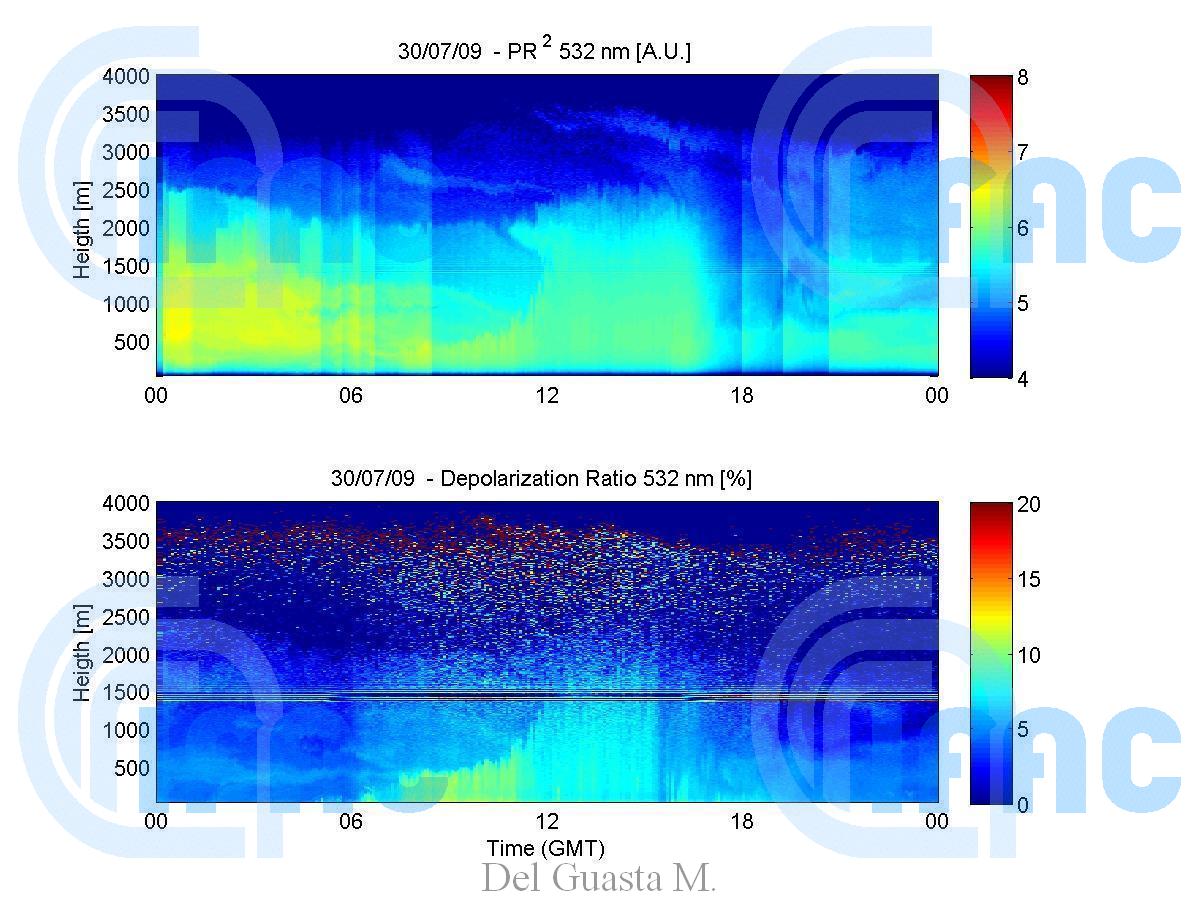
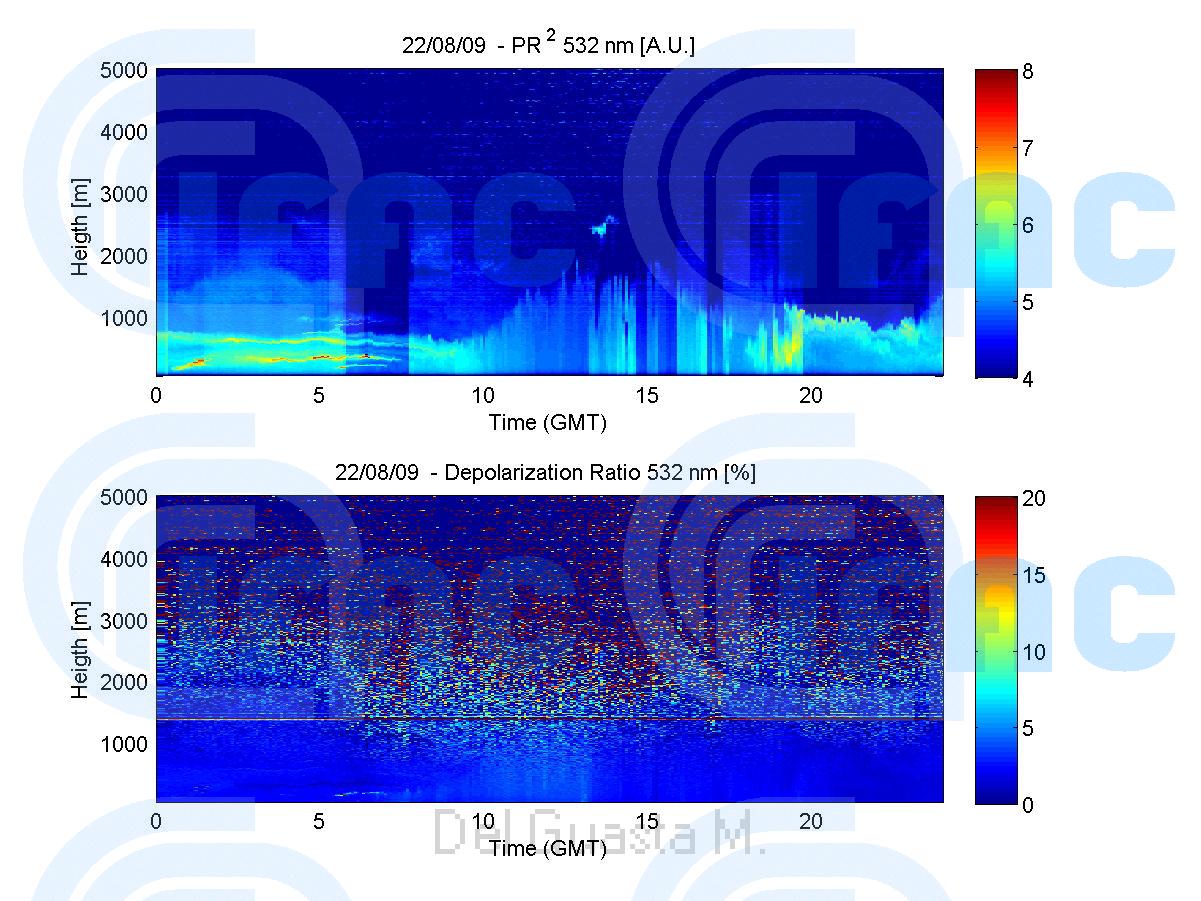
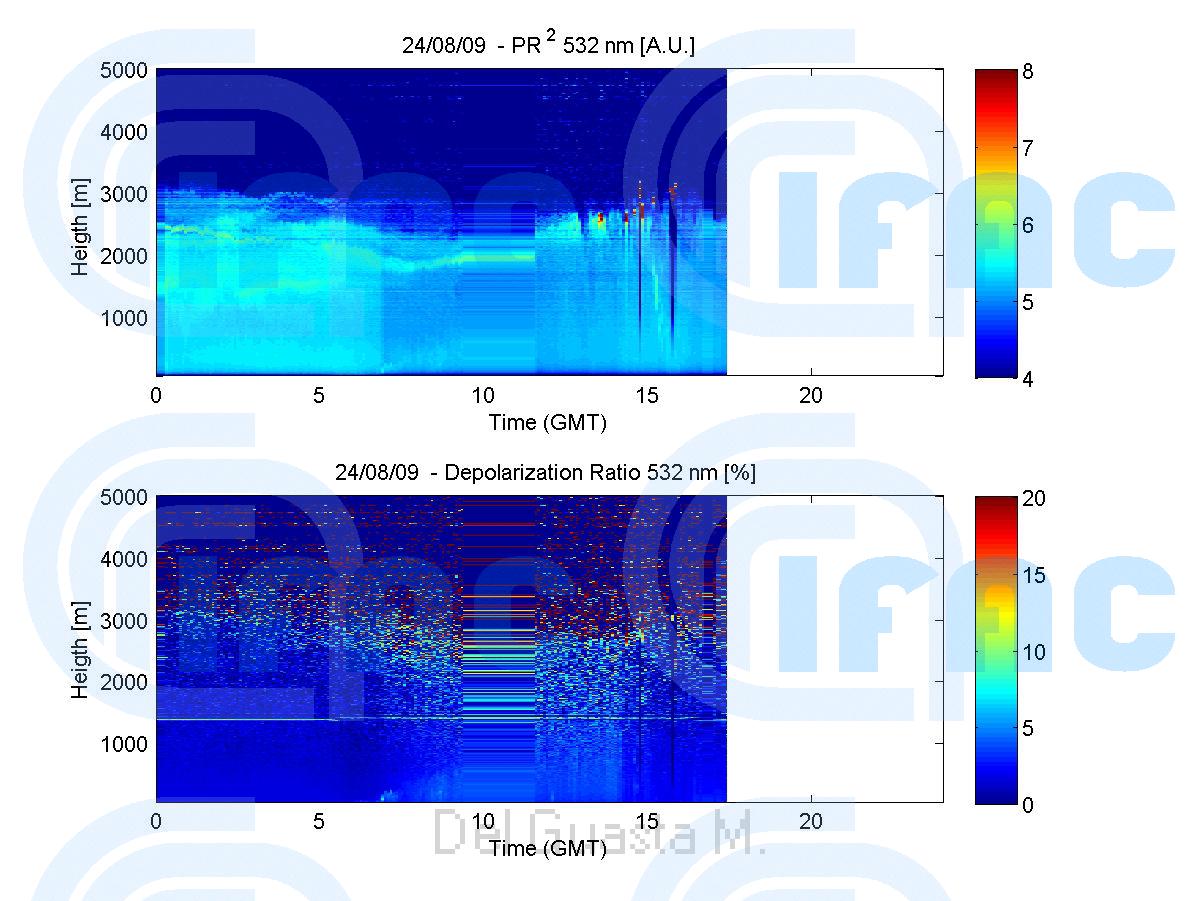
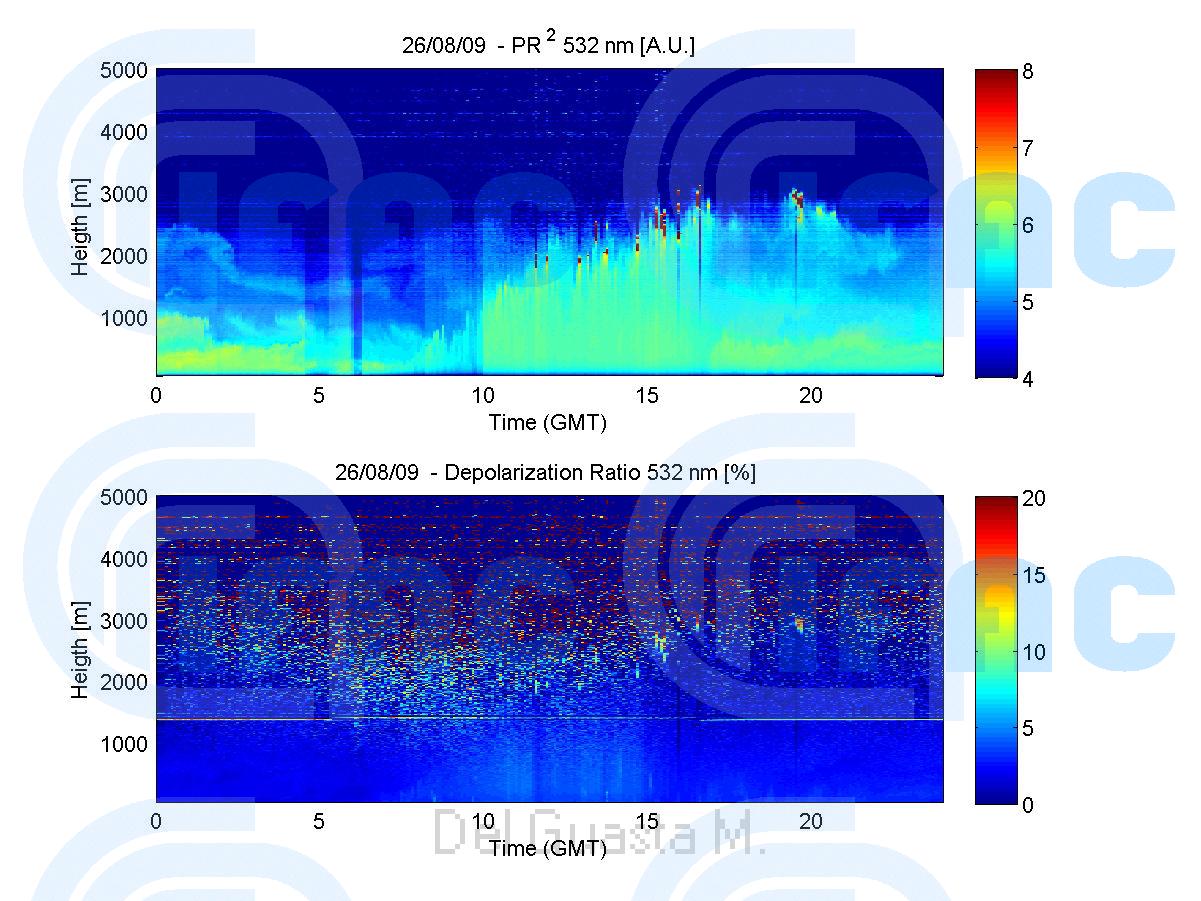
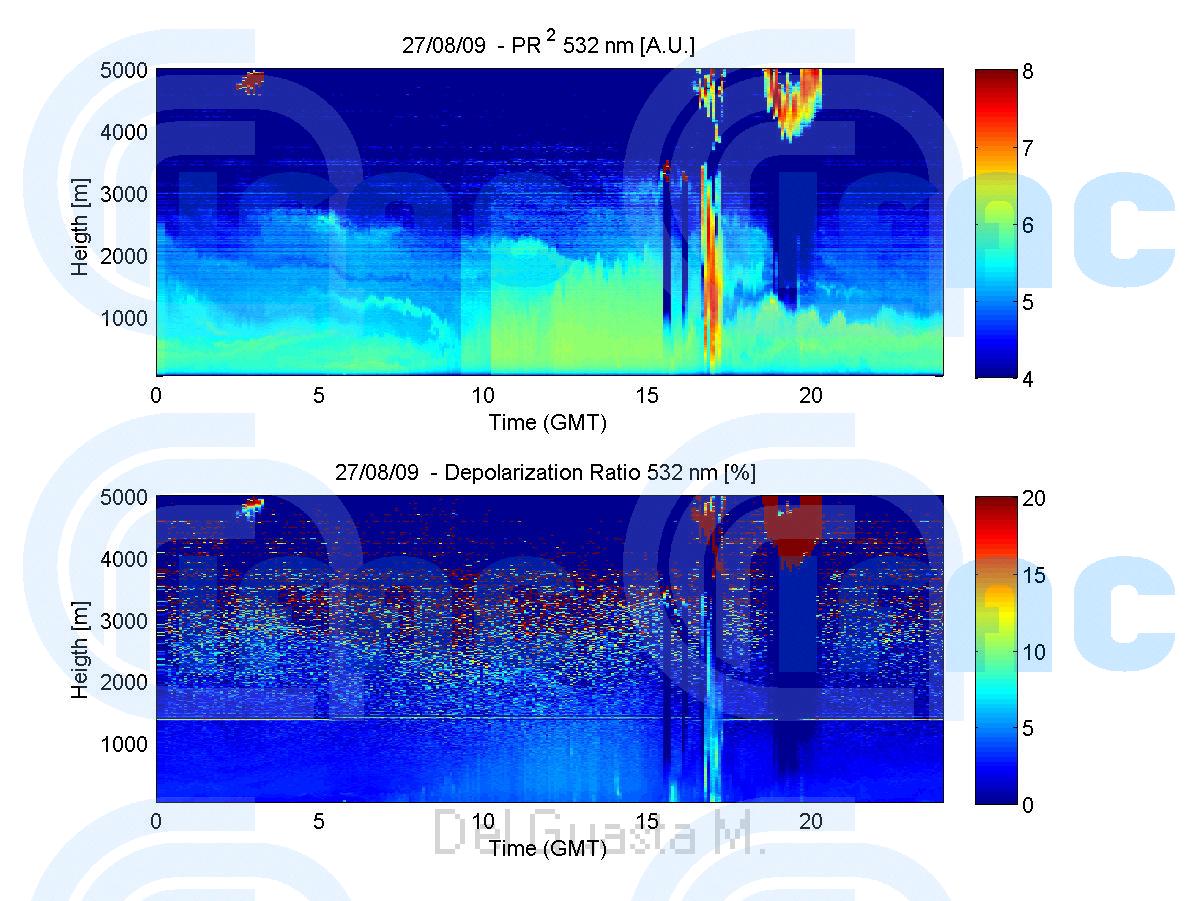
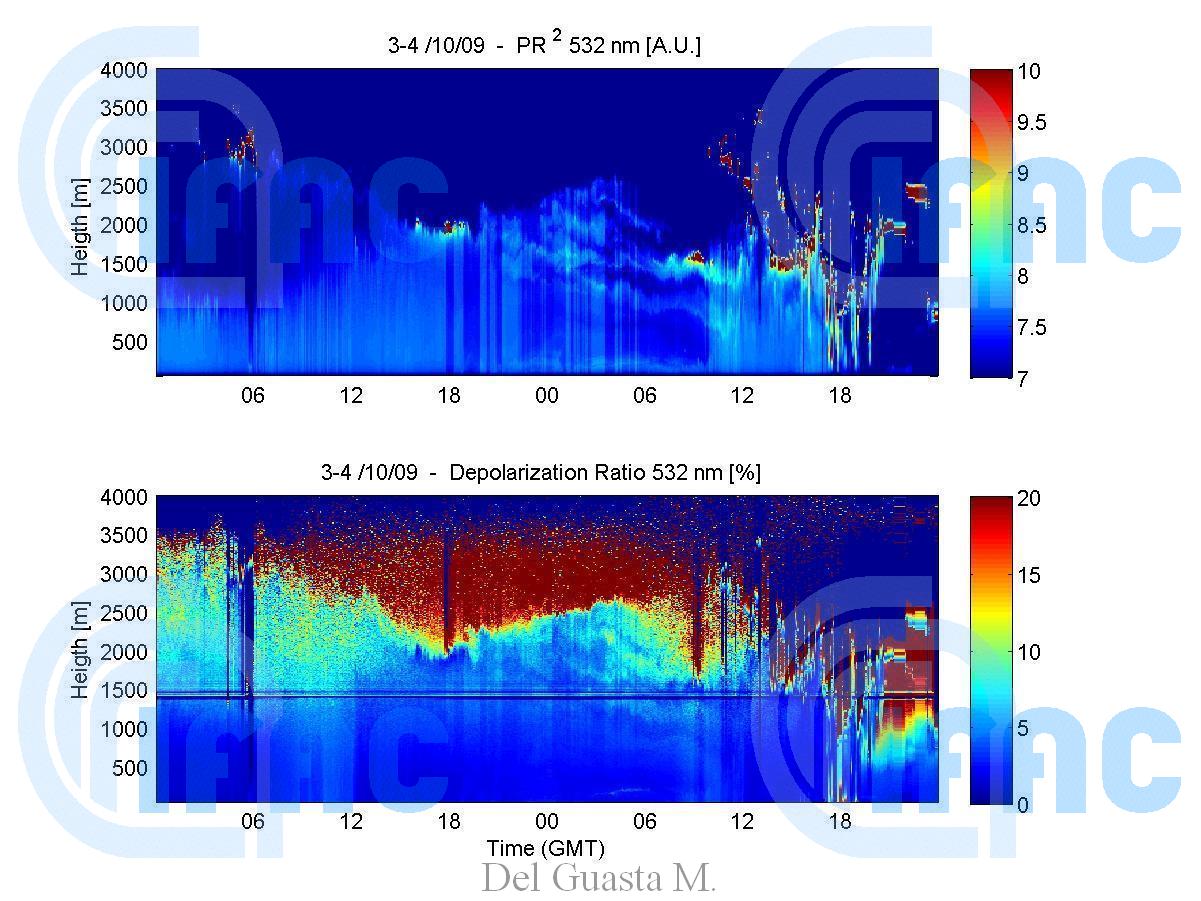
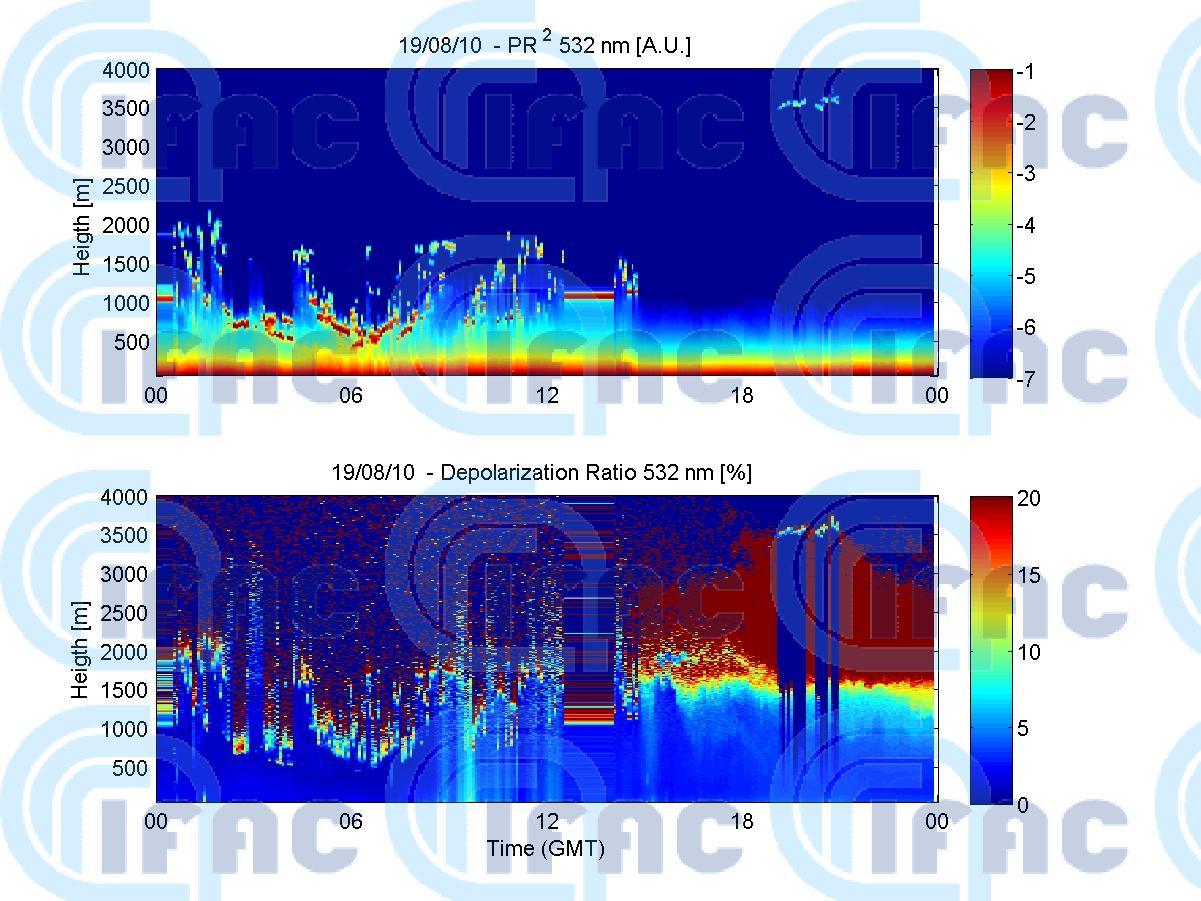
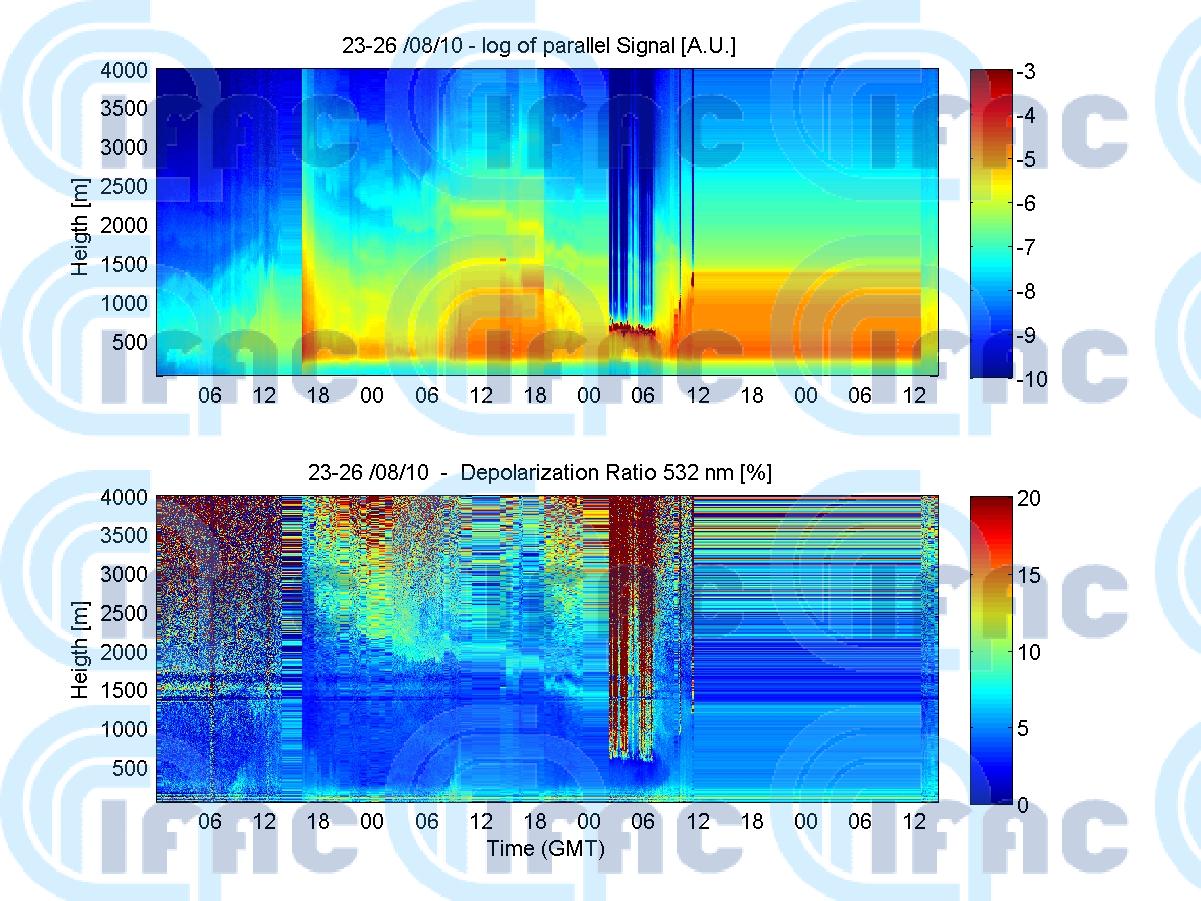
On those days the LIDAR showed Saharan dust at an altitude of between 2000 and 3500 m. The relatively high depolarization of these aerosols, which is shown in the lower plot (depolarization up to 12%), made it very easy to distinguish between PBL and desertic aerosols.

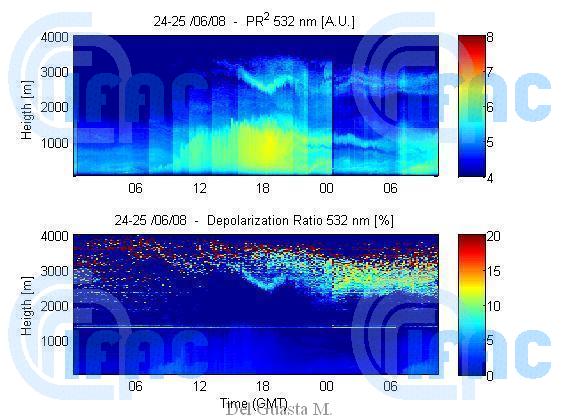
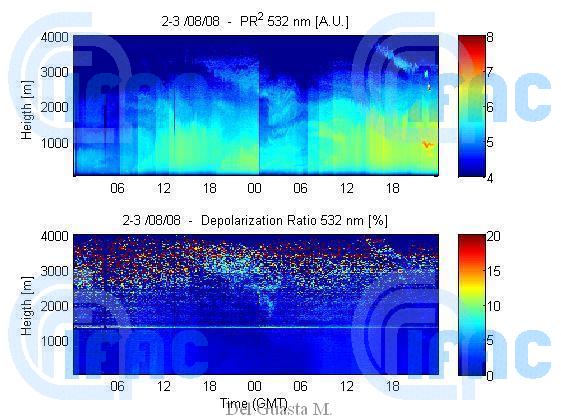
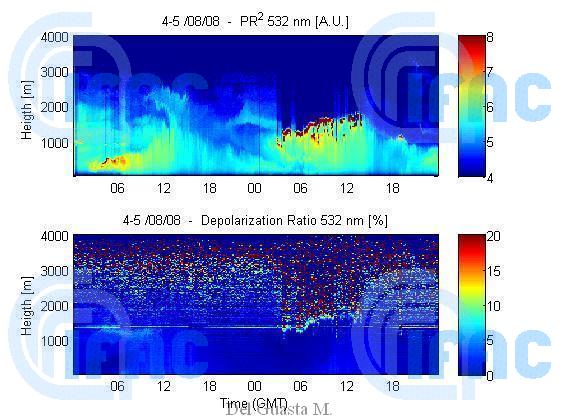
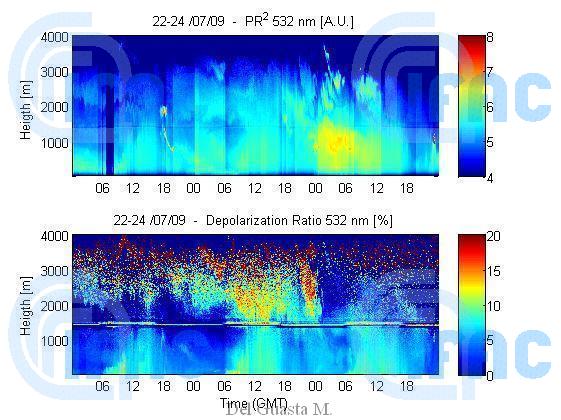
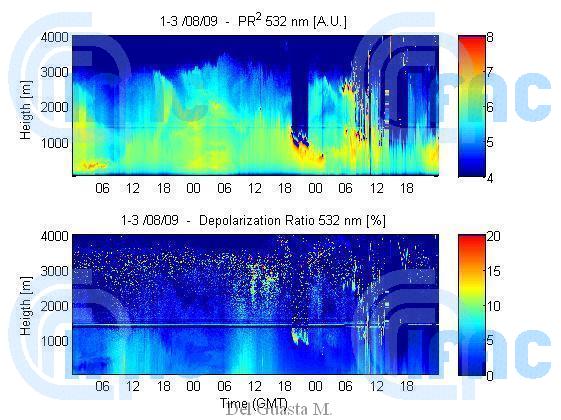
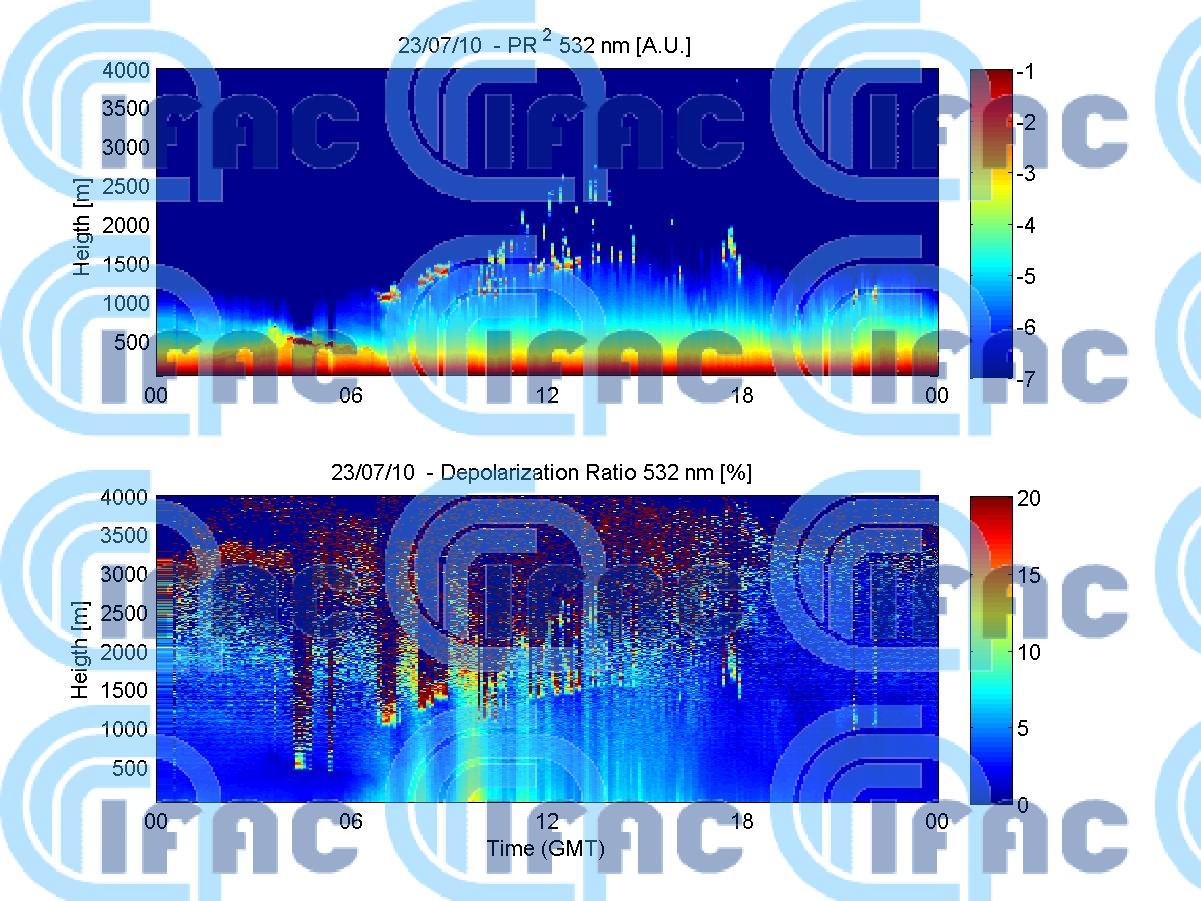
HYSPLIT trajectory analysis shows the origin of airmasses: from Africa, on 22-23 July, from the Atlantic, on July 24. |
NAAPS MODIS shows the same phenomenon: dust (yellow-green) from N-Africa on 22-23 July, replaced by cleaner air on July 24. The forest fires are not shown here. Please see the 22-24 July INO Forest Fire page! |
|
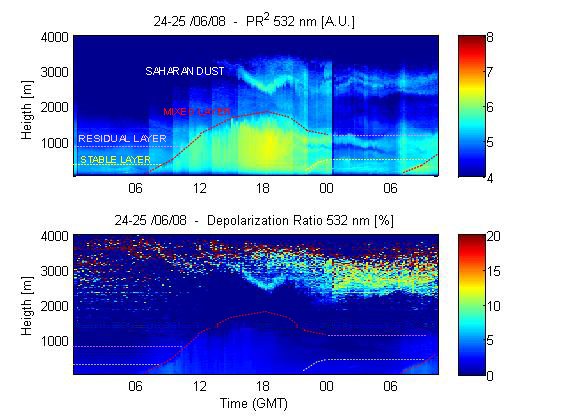
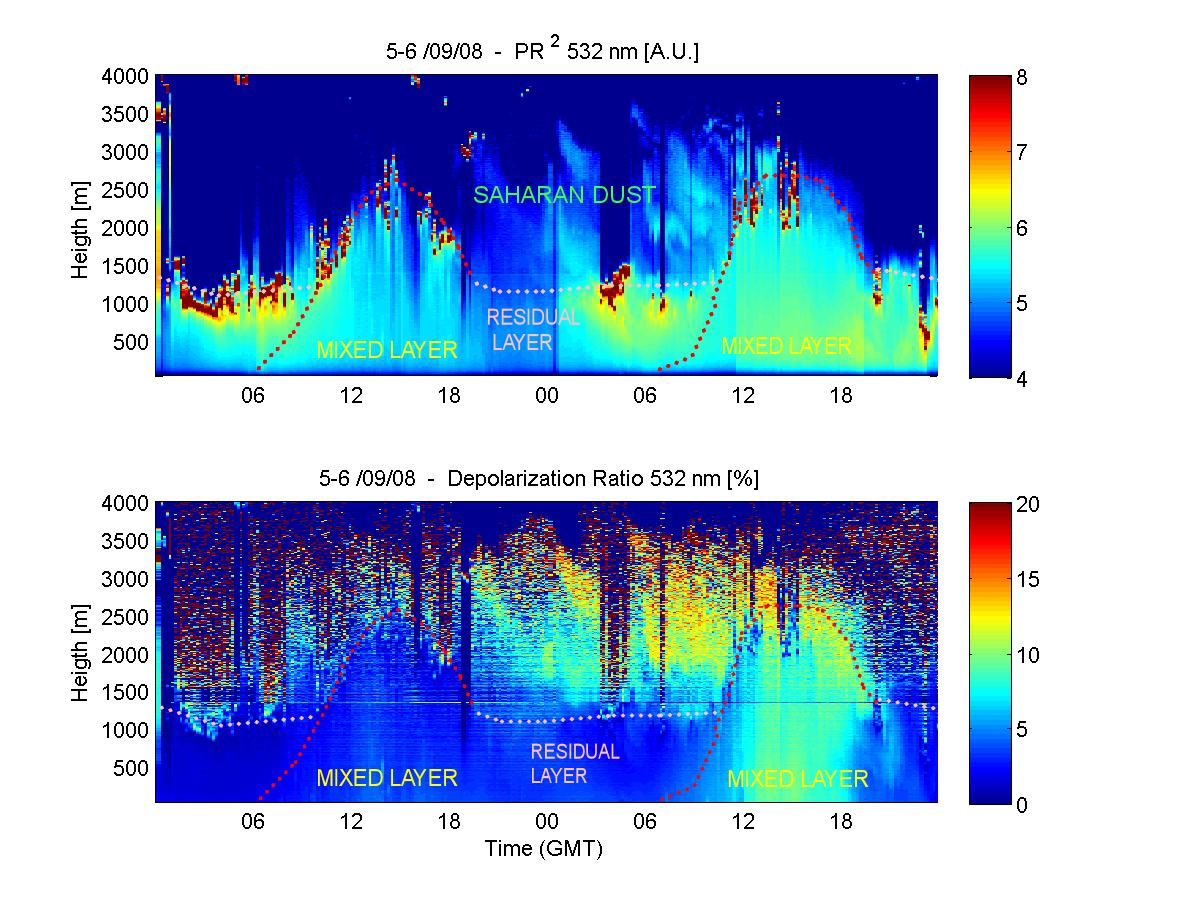
The solar heating causes thermal plumes to rise, transporting moisture, heat and aerosols. The plumes rise and expand adiabatically until a thermodynamic equilibrium is reached at the top of the atmospheric boundary layer. The moisture transferred by the thermal plumes forms convective clouds. Drier air from the free atmosphere penetrates down, replacing rising air parcels. The part of the troposphere between the highest thermal plume tops and deepest parts of the sinking free air is called the entrainment zone. The convective air motions generate intense turbulent mixing. This tends to generate a mixed layer, which has potential temperature and humidity nearly constant with height. When buoyant turbulence generation dominates the mixed layer, it is called a convective boundary layer (CBL). The lowest part of the ABL is called the surface layer. In windy conditions, the surface layer is characterized by a strong wind shear caused by friction. The boundary layer from sunset to sunrise is called the nocturnal boundary layer. It is often characterized by a stable layer, which forms when the solar heating ends and the radiative cooling and surface friction stabilize the lowest part of the ABL. Above that, the remnants of the daytime CBL form a residual layer. |
 Schematic fair-weather atmospheric boundary layer structure over land.
Under high pressure, divergence of air masses shallows the boundary layer. Typically, only fair-weather cumulus clouds are present. The analysis of the boundary layer structure is not usually that straightforward in the case of low pressure. The air parcels converge in low pressure in connection with updrafts, which transfer boundary layer air parcels high above the ground. The clouds may then grow to the top of the troposphere. This leads to extensive variations in the local boundary layer top. Thus, it becomes difficult to define a larger scale boundary layer depth. |
Massimo Del Guasta - National Institute of Optics (INO) - National Research Council | Via Madonna del Piano, 10 - 50019 Sesto Fiorentino - Firenze, Italy | Tel (office): +39-055-5226423 - Tel (laboratory) +39-055-5226424 | Email: Massimo Del Guasta | Web: www.ino.it | sito ottimizzato per una risoluzione minima di 1024x768 e firefox
 BioOptics
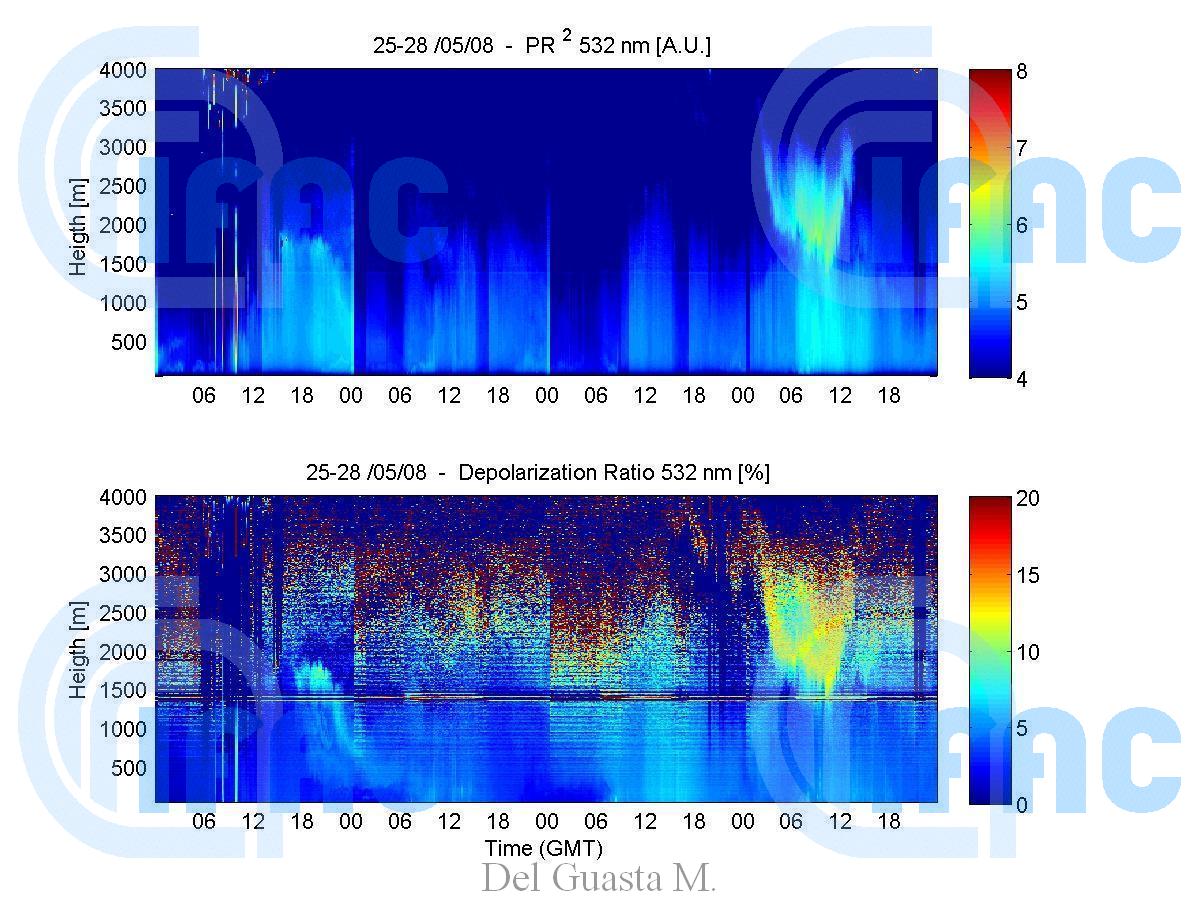